
What Explore Can Answer
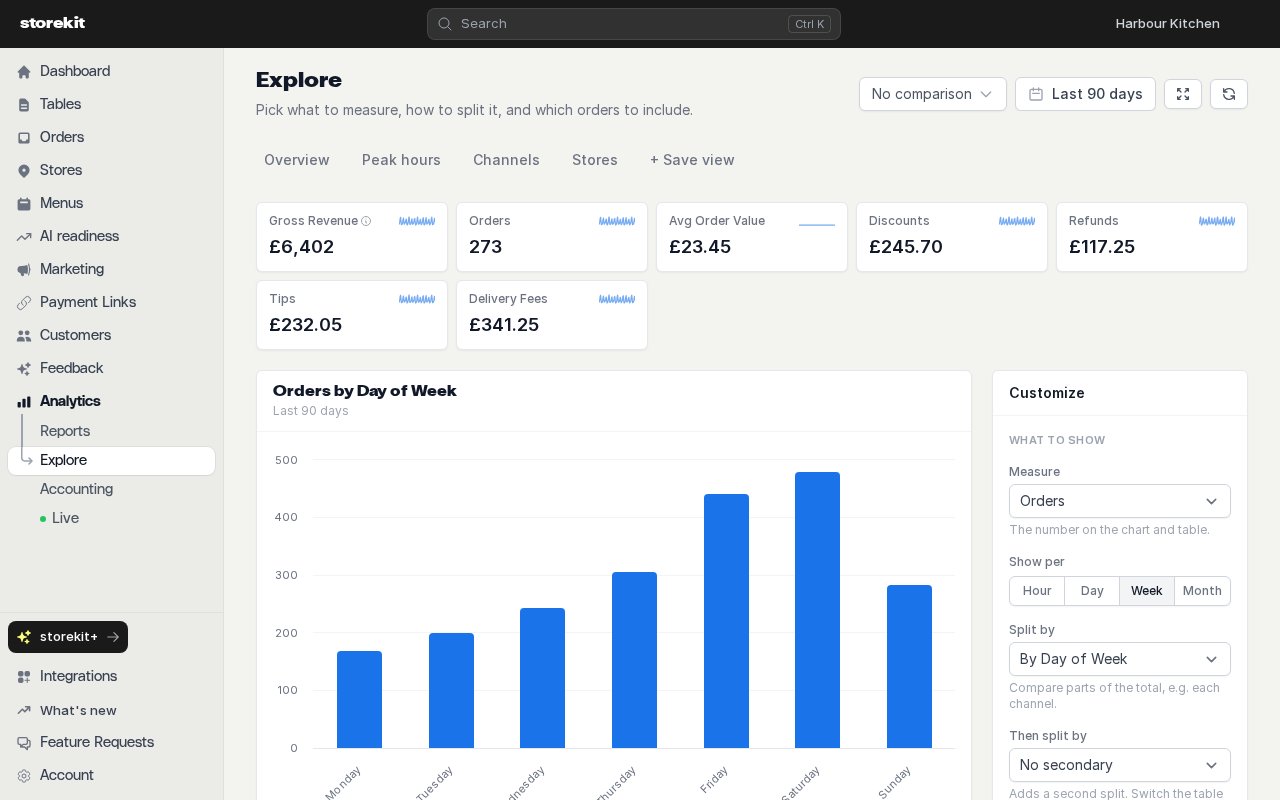
- Which day of the week or hour has the most orders or revenue.
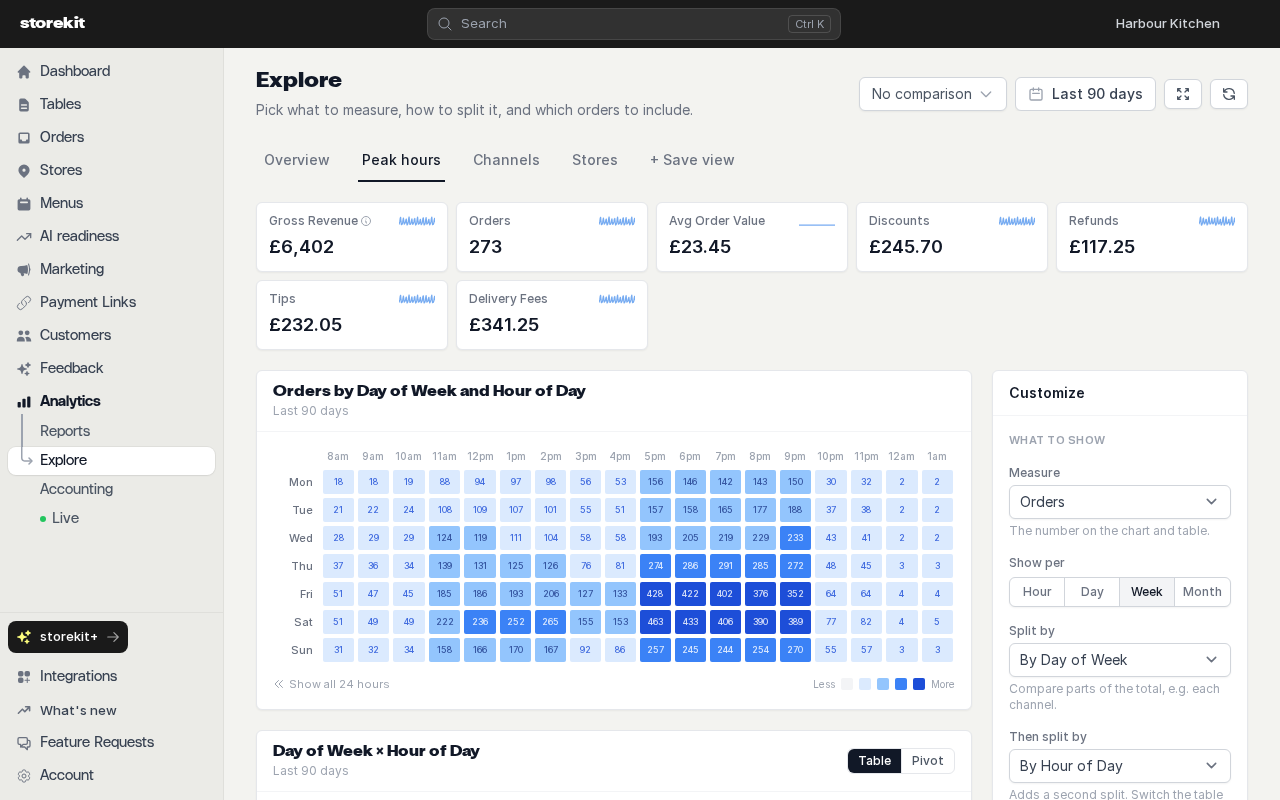
- When order activity peaks across the week, using a day-by-hour heatmap.
- How revenue, order value, refunds or service times vary by store, channel, fulfilment or order timing.
- How a measure changes by hour, day, week or month.
- Which orders make up a value in a table, by opening its order drilldown.
The Controls
Click a data-table row to open the matching orders in a drilldown panel.
Fixed Options
Measures
The Measure list is fixed at 14 options.Breakdowns
The Split by list is fixed:
Then split by is limited to these fixed combinations:
No breakdown has no second-breakdown options.
The Then split by selector also has a fixed No secondary option.
Charts and Time Intervals
The fixed chart types are Line, Bar, Stacked, Area and Heatmap. Heatmap is enabled only for the By Day of Week and By Hour of Day pair. The chart shows the chosen measure in each weekday-and-hour cell. The fixed Show per intervals are:Fulfillment and Channel Filters
The Fulfillment filter has these fixed options: Delivery, Pickup, In-Store, Curbside, Catering Delivery and Catering Pickup. The Channel filter has these fixed options: Web, App and Kiosk.Periods and Comparisons
The date-range picker has these fixed preset periods, as well as Custom range:
The comparison choices depend on the selected period. These lists are fixed:
The default comparison value is
month. For a 30-day period, it compares the selected dates with the same dates shifted back 28 days—an earlier period, not a calendar month. If that comparison is not available for the chosen period, Explore uses No comparison.
Built-In and Saved Views
Explore includes four built-in views:
The Peak hours built-in view displays a heatmap of orders by day and hour:
Questions You Can Answer
Each link opens a report with the listed settings. These examples use the most recent 90 days.
The busiest-day recipe above displays orders by day of the week as a bar chart:
Linking to a Pre-Filled View
The dashboard URL ishttps://dashboard.storekit.com/sales. In-dashboard links use the path form /sales?…. Query values are case-sensitive.
Use
stores with comma-separated venue IDs to keep a store selection in the link. Use from and to together to keep a custom date range.
Select Copy link in the controls to copy the current report URL. In the second example, replace 12345 with the venue ID for your store.